Climate change, land use, water resources, farmer prosperity and food loss and waste are Cargill's priority sustainability topics.
Planet
Based on the vision of “being the most trustworthy partner in agriculture, food, and nutrition,” Cargill focuses on five key sustainability priorities: climate change, land use, water resources, farmer prosperity and food loss and waste.
As a differential, Cargill delivers to its customers products whose value includes quality and sustainability, fostering a healthy production and consumption cycle that, in addition to corroborating the company’s objectives, contributes to the conservation of natural resources.
The company works worldwide with customers, NGOs, farmers and other stakeholders to accelerate strategic planning and actions for each of the five focus areas, always taking global and local factors into account.
Global priority sustainability topics
Land Use
Transforming our supply chain to be deforestation-free by 2030.
Climate Change
Reducing absolute emissions in our operation by 10% by 2025, with the 2017 baseline.
Water Resources
Increasing water use efficiency by 5% by 2020 with the 2015 baseline.
Farmer Prosperity
Providing training on good agricultural practices and improving market access for 10 million farmers by 2030.
Food Loss and Waste
Driving food system innovation to prevent food loss and waste of food and other materials.
In Brazil, in addition to the global priority topics, the Sustainability Committee has defined local priority aspects. For the “land use” and “food loss and waste” topics, strategies, goals and a business action plan will be outlined. The “water” and “energy” topics are currently undergoing quarterly follow-ups, as these are subjects around which the company has developed its operation and management methods in recent years.
In the next chapters, Cargill discloses the main environmental indicators in each of its business units and operations in Brazil, according to their materiality.
* In the 2017 Annual Report, Cargill contemplated, for the Sugar and Ethanol unit, the operations of the Cevasa Plant (100% operated by Cargill) and the SJC Plant (Joint Venture). This year, the company chose to report environmental data only from its own unit (Cevasa).
** To improve EHS performance, the Cocoa and Chocolate units have implemented the Management System with a focus on ISO 14000 and 45000, whose scope is Porto Ferreira (SP): maltodextrin spray drying and corn syrup; chocolate and topping manufacturing; production of functional systems (dry mixtures). Ilhéus (BA): receipt and processing of cocoa almonds for the production, storage, and shipment of cocoa liquor, powder, and butter.
Business unit
Operations
Sugar and Ethanol*
Cevasa
Grains and Processing
- Plants: Ponta Grossa, Barreiras (BA), Primavera do Leste (MT), Três Lagoas (MS), Rio Verde (GO)
- Ports
- Warehouses
Cocoa and Chocolate**
Ilhéus (BA) and Porto Ferreira (SP
Animal Nutrition
Chapecó (SC), Itapira (SP), Toledo (PR) and Goianira (GO)
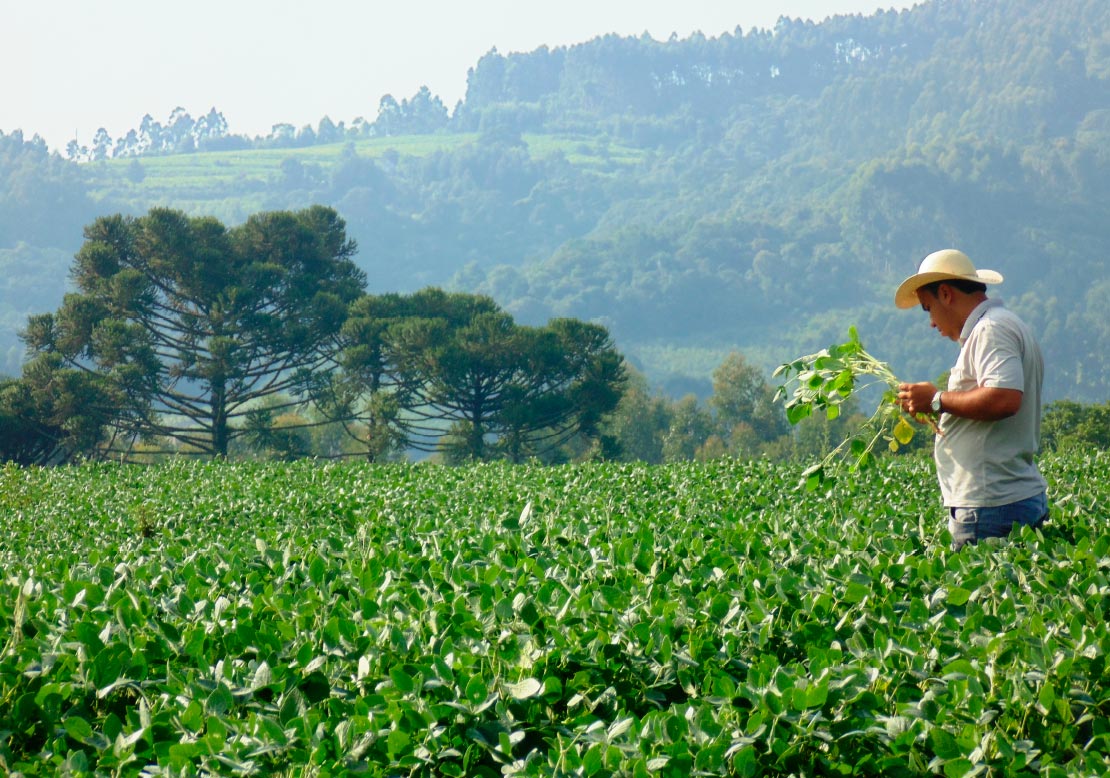
Cargill believes that forests and agriculture can and must coexist to sustain the health of people and the planet. Therefore, it is committed to working in partnership with suppliers, customers, NGOs, and governments to innovate and scale real solutions in this regard.
The company is committed to ending deforestation in its supply chains, respecting people and defending human rights through its policies and action plans.
One of Cargill’s major highlights in this area in fiscal year 2018/2019 was the updating of its Policy on Forests6, whose main innovation was the preparation of a forest-related management model that goes beyond a public commitment. The new policy provides definitions of processes, analyses, risk assessments and implementation of actions that are effective in the territories, as well as a holistic look at all areas of the company, not only the soy production sector.
Other highlights were the launch of the South America Sustainable Soy Policy7 and the Commitment on Human Rights8, reinforcing Cargill’s intention to make the necessary changes to reach deforestation-free supply chains.
To learn more about the company’s key actions to eliminate deforestation and improve sustainability in its priority chains, please refer to the “Supply Chain” chapter on page 21.
Cargill’s forest protection principles include:
Ensuring supply transparency and practices to identify the most pressing issues and creating practical solutions based on the shared understanding of the challenges;
Balancing the needs of the planet and people, encompassing inclusive growth and sustainable development;
Transforming supply chains through collaborative efforts that drive change on scale.
Cargill’s strategic waste management is based on the guidelines of the EHS (Environment, Health, and Safety) Policy, the company’s global policy, and the National Solid Waste Policy (PNRS) of the Ministry of the Environment.
All waste is duly treated and disposed of according to the specifications for each type. Hazardous waste is intended for co-processing, reverse logistics, landfills, autoclaves, decontamination (lamps), controlled incineration, reprocessing, reuse, blending, re-refining, and recycling. Non-hazardous waste is sent for recycling, industrial landfills, construction waste landfills, reuse, co-processing, composting, biological treatment, reuse, and recovery. Organic waste, in turn, is sent for composting, fertigation, landfills and industrial landfills, and recycling.
* GRI 306-4: 100% of hazardous waste transportation is carried out nationwide, and 100% of this waste is treated. The total weight for transportation of this type of waste for each unit is the same as reported in the table above.
** The variation in values between fiscal years in the Grains and Processing unit is due to the change in information management of plants, which were migrated to another system, making it impossible to enter data during the migration period.
*** Data for fiscal year 2017/2018 include only the Mairinque operation. The fiscal year 2018/2019 includes Mairinque and Ponta Grossa, which is why the variation is greater between the years.
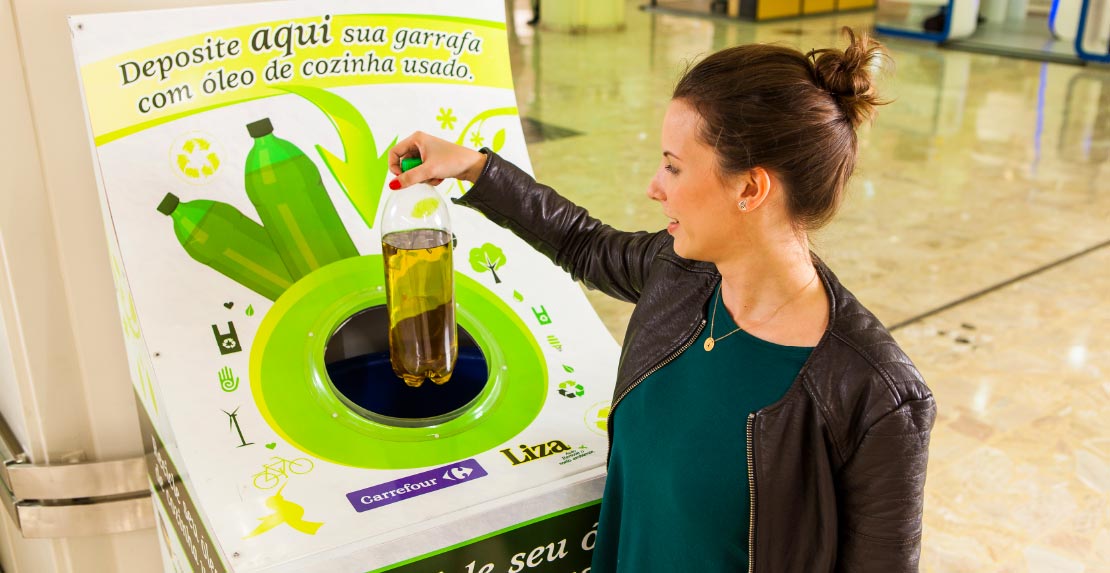
Ação Renove o Meio Ambiente Program
Since 2011, Cargill has carried out the Ação Renove o Meio Ambiente Program, which offers consumers a practical and sustainable alternative for the environmentally sound disposal of vegetable oils and fats. The program is developed through the Liza brand and works as a front for education and environmental awareness. It has over 1,000 collection points distributed across 10 Brazilian states (São Paulo, Rio de Janeiro, Minas Gerais, Goiás, Santa Catarina, Paraná, Rio Grande do Sul, Mato Grosso do Sul, Bahia, and Pará)9 and has collected to date over 3.5 million liters of vegetable oil and fat residues. Of this total, 853,078 liters corresponds to 2018. Click here to access the complete list with all collection points.
Last year, besides the collection points available in shopping malls, supermarkets, and bakeries, there has been an intensification of environmental education actions in schools. There are already 20 municipalities with oil collection in schools, the main highlight being the city of Mairinque, in the interior of São Paulo: it features collection points for oil in all 39 municipal schools, and the Program has an exclusive Environmental Educator, who works in partnership with the Secretariat of Education and the Secretariat of the Environment of the Municipality.
In addition to making oil delivery points available to communities, the company offers the Program to Food Service customers who use Cargill products in restaurants across Brazil.
The company also offers a reverse logistics management service, ensuring the collection, final disposal, issuance of certificates of destination, indicators, and full traceability of the collected waste. The last step is the production of biodiesel, which is a cleaner and renewable source fuel.
The Ação Renove o Meio Ambiente Program, in 2018, led
to the correct destination of more than 850 thousand liters of used cooking oil
Reverse Packaging Logistics
To ensure compliance with the National Solid Waste Policy, Cargill works on a circular economy model, fostering its recycling chain and encouraging communities to recycle. Some examples of actions that promote the recycling of company packaging are:
•
Casa Soma Vantagens Casa Soma is a “house” based in the district of Grajaú, in the São Paulo state capital, which is part of the Soma Vantagens Program, whose goal is to change the behavior of the population through incentives. After applying and receiving a card, people can deliver packaging for recycling and earn points, which can be redeemed for courses, exams, basic food items, supermarket discounts, and other benefits.
Today, more than 700 families are registered, and more than 1,000 exchanges have been made. Many people have been able to exchange their waste for courses such as manicure and pedicure, cutting and sewing, coding for non-programmers, and services such as ophthalmology consultations.
•
Retorna Machine To encourage consumers to recycle the Liza, Pomarola, and Elefante product packaging, Cargill has invested in innovation and technology and has partnered with Triciclo, deploying 7 Return Machines in the São Paulo Metro Area, in supermarkets, universities, and subway stations. These machines, common in Europe, offer an extra option for people to participate in the recycling process.
Its operation is very simple: the registration is made on the machine itself, by the app, or on the Internet. After registration, the consumer enters their Taxpayer ID (CPF) number on the machine and inserts their packages, earning points in a Loyalty Program. Points can be redeemed for mobile credits, Bilhete Único credits (public transportation), electricity bill discounts, and bookstore discounts, among other benefits. So far, more than 41,000 packages have been collected.
•
Cooperativas de catadores
The recycling system in Brazil is highlighted by the work of the Recycling Cooperatives, scattered across the country. Typically, they need support to improve their structures and technical capacity to absorb a larger volume of material and generate better income for their members.
For this reason, Cargill, alongside ABIOVE (Brazilian Association of Vegetable Oil Industries), has partnered with Boomera to make investments in Recycling Cooperatives in various regions of the country. There are currently 14 Cooperatives supported in nine Brazilian states.
The project makes a diagnosis of cooperatives to identify their needs and, based on the results, develop an action plan that includes regularization, infrastructure investments, capacity building, management, and support to members.
Cargill also has a partnership with the NGO Recicleiros, which develops the CIDADE+ Program, a benchmark in the development of the Reverse Logistics system in various Brazilian municipalities.
Reducing greenhouse gas emissions in production, industrial and transportation processes is Cargill’s main goal in this area.
By 2017, the company had a global target of 5% reduction in greenhouse gas (GHG) emissions intensity by 2020, considering fiscal year 2014/2015 as the basis. In February 2018, it committed itself to a more ambitious target: a 10% reduction in the absolute value of its global emissions by 2025, considering fiscal year 2016/2017. This means that, even as the company grows, emissions are expected to reduce.
Cargill’s commitment is in line with the goals presented by the scientific community of keeping global temperature increases below 2 degrees Celsius. The company’s targets encompass emissions known as Scope 1 and 2 and correspond to reductions of about 1.25 million metric tons of carbon dioxide equivalent (CO2eq) each year.
In this sense, during fiscal year 2018/2019, Cargill advanced on the topic and created a new type of reporting in its management system, enabling the monitoring and management of its absolute emissions, according to the new target.
Also related to the topic, Cargill has goals of increasing energy efficiency and increasing the use of renewable energy – strategies that also contribute to reducing emissions.
The results of the company’s emission indicators, as well as variations between fiscal years, are detailed in the following tables.
* Calculations include the CO2, CH4, NH4, N2O, and HFC gases. Cargill Animal Nutrition has no direct emission sources.
** Includes only the Starches and Sweeteners unit of Castro. The Uberlândia unit does not control direct emissions.
*** Data for fiscal year 2017/2018 include only the Mairinque operation. Data for fiscal year 2018/2019 include Mairinque and Ponta Grossa, which is why the variation is greater between the years.
**** Includes only the Cocoa and Chocolate unit of Ilhéus. The Porto Ferreira unit does not control biogenic emissions.
***** The Foods unit does not measure direct GHG emissions, only biogenic emissions. Accordingly, the amount published in the 2017 Annual Report is incorrect.
* Calculations include CO2, CH4, and N2O gases.
** The significant variation is due to higher energy consumption in fiscal year 2018/2019, caused by factors such as increased production and plant maintenance.
*** Includes only the Cocoa and Chocolate unit of Ilhéus. The Porto Ferreira unit does not control indirect emissions.
**** Includes only the Starches and Sweeteners unit of Castro. The Uberlândia unit does not control indirect emissions.
***** Data for fiscal year 2017/2018 include only the Mairinque operation. Data for fiscal year 2018/2019 include Mairinque and Ponta Grossa, which is why the variation is greater between the years.
Indirect Emissions from Energy Acquisition (tCO2eq)
* The Sugar and Ethanol unit does not perform this measurement. Accordingly, the amount published in the 2017 Annual Report is incorrect.
** The calculation for the Foods unit emissions intensity was based on biogenic emissions since there is no control of direct gross GHG emissions.
*** Includes only the Starches and Sweeteners unit of Castro. The Uberlândia unit does not control the intensity of emissions.
**** Data for fiscal year 2017/2018 include only the Mairinque operation. Data for fiscal year 2018/2019 include Mairinque and Ponta Grossa, which is why the variation is greater between the years.
Business unit
2017/2018
2018/2019
Variação
Grains and Processing
0.0013
0.0013
0%
Cocoa and Chocolate
1,699.2000
1,716.4200
1%
Foods**
0.2600
0.2900
12%
Starches and Sweeteners***
0.0400
0.0300
-25%
Bioindustrial****
0.0700
0.4700
571%
Total
1,699.5713
1,717.2113
1%
NOx and SOx emissions and other significant atmospheric emissions (t)*
* The Bioindustrial unit does not measure atmospheric emissions.
** NOx and SOx data include only the Ilhéus unit. The significant increase in NOx emissions is due to the higher biomass consumption of this unit in 2018/2019. It should be noted that, despite this increase, emissions are within the acceptable limits under the legislation.
*** Animal Nutrition data do not include distribution centers and plants in Goianira, Chapecó, and Itapira.
Animal Nutrition***
2017/2018
2018/2019
Variação
NOx
0.00
0.00
-
SOx
0.00
0.00
-
Volatile Organic Compounds (VOC)
0.00
0.00
-
Particulate Matter (PM)
4.48
3.40
-24%
Total
4.48
3.40
-24%
Foods****
2017/2018
2018/2019
Variação
NOx
52.09
81.90
57%
SOx
0.00
0.00
-
Volatile Organic Compounds (VOC)
9.58
9.58
0%
Particulate Matter (PM)
52.10
105.95
103%
Total
113.77
197.43
74%
**** Significant variations of NOx and PM are explained by the system’s operational variation at the time of collection, which is used on an ad-hoc basis.
Starches and Sweeteners
2017/2018
2018/2019
Variação
NOx
148.60
104.45
-30%
SOx
106.09
115.70
9%
Volatile Organic Compounds (VOC)
5.03
0.06
-99%
Particulate Matter (PM)
447.02
348.26
-22%
Total
706.74
568.47
-20%
5th Cargill Sustainability Award
Targeted at employees, interns and third parties, the Cargill Sustainability Award is a competition sponsored by the company in Brazil to acknowledge and reward sustainable practices and projects at Cargill or in the communities where the company operates. In its 5th edition, held in 2019, the award presented the theme “Greenhouse Gases.”
The authors of the winning projects received a trophy and a gift certificate of R$ 1,000. In addition, they were invited to attend a management meeting at the headquarters in São Paulo to present their projects to Cargill’s directors. Learn more about the awarded projects below:
Fertile Compound
The project proposes the generation of value from the destination to the cocoa almond integument (seed husk that is removed during the grinding process) and the boiler ash that generates energy, in addition to the waste generated from the cocoa almond processing at the Ilhéus plant. The waste is mixed at a specific location and later processed and distributed on the plantations as fertilizer, reducing costs for the purchase of synthetic fertilizers and lowering GHG emissions. Previously, the waste was sent to landfills and/or incineration plants.
Results achieved
Emission reduction: 330 metric tons CO2eq/year in production (compared to what would be emitted using chemical fertilizer)
396
families benefited
1,123 metric tons of organic compost produced per year
Energy Efficiency The goal of this project is to improve the monitoring control of atmospheric emissions and boiler combustion, increase the condensate return rate of the primary process, and reduce deaerator steam consumption, thereby reducing biomass and atmospheric emissions. Developed at the Goiânia unit, the project implemented the following actions: installation of two oximeters, three opacimeters and frequency inverters in the boiler engines, automation in the boiler combustion control loop, and installation of a heat exchanger in the condensed tank flash steam outlet.
Results achieved
Reduction in biomass consumption: 5,250 metric tons/year
Savings of 22,246 m3 of water that would be used for steam generation per year
Emission reduction: 5,911.6 metric tons of CO2/year
Biogas Reuse
The idea is to reuse biogas produced in the wastewater treatment process in anaerobic reactors as fuel for the high-pressure boiler at the soybean oil refinery in Uberlândia (MG). Today, the boiler uses LPG (Liquefied Petroleum Gas) as its fuel for burning and steam generation, and the biogas produced is burned and discharged into the atmosphere. The project aims to eliminate LPG consumption and install a process for the capture and treatment of sulfur residues and to pump and transport gas from the Wastewater Treatment Plant (WWTP) to the refinery boiler, which will be adapted with a burner for the new biofuel.
In addition to specific water management policies in its different business units, Cargill has a unique policy to conduct all its activities to protect the environment and the health and safety of employees, contractors, customers, and communities. The company’s overall goal is to increase water use efficiency by 2020 and achieve a reduction compared to the consumption for the year 2015, which was 8.9 million m3.
In Brazil, in fiscal year 2018/2019, Cargill reported a 4% reduction in water consumption compared to the previous year. The reduction in water consumption between fiscal years was due to the increased efficiency of water-related processes in business units, exceeding the target for the fiscal year (see the following tables).
A major highlight of the period was the creation of a water reuse project at the Starches and Sweeteners unit in Uberlândia (MG). The initiative treats wastewater through purification processes, and the idea is to reuse 95 m3/h of treated water in cooling towers and reduce the unit’s drinking water consumption by 30%. This amount is equivalent to the daily consumption of a city with 17,000 inhabitants.
* Data for fiscal year 2017/2018 include only the Mairinque operation. Data for fiscal year 2018/2019 include Mairinque and Ponta Grossa, which is why the variation is greater between the years.
** The total amount of recycled and reused water refers to the Sugar and Ethanol, Cocoa and Chocolate (Ilhéus), Animal Nutrition (Chapecó), Foods (Goiânia and Mairinque) and Starches and Sweeteners (Uberlândia) business units. Other units do not reuse/recycle water in their processes or do not currently manage this data.
* Animal Nutrition data do not include the Itajaí (SC) and Cuiabá (MT) plants and the Goiás Distribution Center, as these facilities only generate domestic sewage. The increase in effluent disposal between fiscal years is due to the purchase of a plant in 2018, in Goianira (GO).
** Data for fiscal year 2017/2018 include only the Mairinque operation. Data for fiscal year 2018/2019 include Mairinque and Ponta Grossa, which is why the variation is greater between the years.
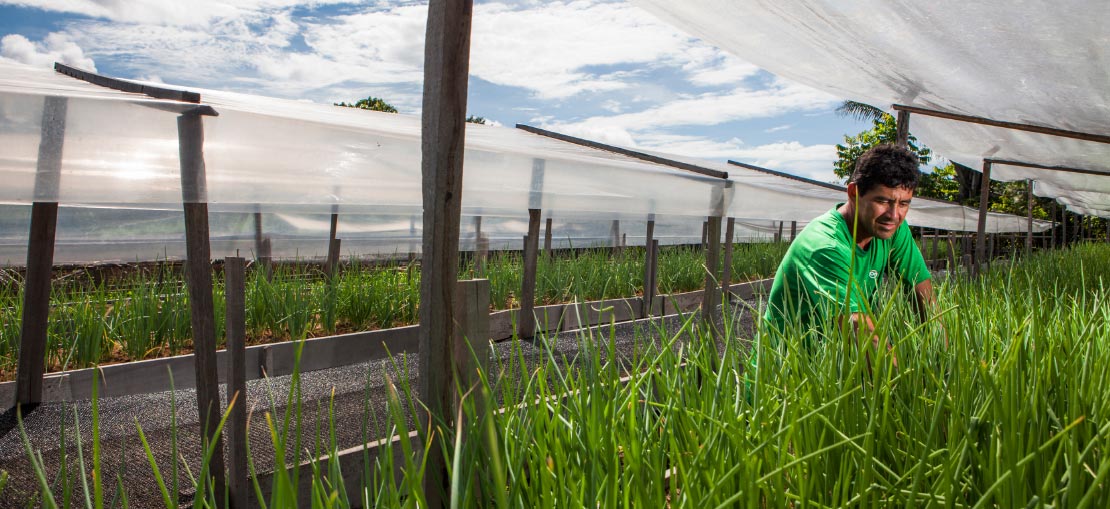
Sustainability in the tomato chain
In partnership with Fundação Espaço Eco, Cargill conducts the Life Cycle Analysis (LCA) of all products in its tomato line. Research is a valuable management tool that indicates the eco-efficiency of the supply chain, considering environmental and economic factors at all stages of the process, from the extraction of natural resources to the distribution of the finished product and the packaging recycling index. Based on this analysis it was possible to reduce, for example, the use of water by 68% in the production of Extrato Elefante between 2014 and 2017. Today, the company knows exactly the impact of each product and each package and knows where actions are needed to act to reduce this impact.