How to Read the Market's Irrationality
For decades, analysts and economists held a fundamental belief that the individual player in the marketplace was a “rational economic man” who acted in his or her own best interest and made dispassionate choices based on all available data.
The reality that most experts have come to accept today is that this simply is not the case. The supposedly rational individuals operating in markets actually are often quite irrational or driven only partly by rationality.
Irrational behaviors from individuals added together create market trends, sometimes overshadowing the fundamentals. Prices can become self-fulfilling realities, as populations act around those perceived trends and only serve to reinforce them. In recent years, new networks of information have evolved to understand these forces. Today, charts provided through tools from Bloomberg, Reuters and others have become reliable ways to digest all of this information, both rational and irrational.
This market evolution has played out in different ways in agricultural commodities over the past couple of decades. An increased number of investors – many not tied to the physical supply chains of the commodities themselves – have created higher liquidity. Yet, they also have made the markets for those commodities more vulnerable to collective emotion. Today, with higher correlations across sectors like food and fuel, funds using non-fundamentals to trade larger volumes, and geopolitical headlines that create widespread apprehension of major moves, they have only gotten more turbulent. If you are not careful, this irrationality can leave you paralyzed and inefficient.
In the midst of this uncertainty, technical analysis has emerged as a way to examine the overall shape and sentiment of the market. Technical analysis can help you circumvent your own irrationality – that part of each of our brains that is highly averse to loss and seeks out patterns for guidance that may ultimately be misleading.
Technical analysis cannot predict the future. Despite what we may wish, it is not a crystal ball. However, it can be a sextant, guiding you toward the right strategies and products to meet your own goals in a market environment defined by both rational and irrational forces. It takes past analyses into account and uses them to understand what is happening today, as well as different scenarios that could unfold.
The fundamentals of technical analysis
At its most basic, technical analysis assumes that prices reflect all known information about the market: both facts and emotions. The emotion – individuals’ fear, greed, panic and over enthusiasm totaled up in the form of group behaviors – can dramatically affect prices.
When trying to break apart this collective irrationality, there are three central components to examine.
The first component is the set of trends in a market that illustrates patterns operating at a point in time. This is the way individuals and groups look at what is happening now and make decisions about the degree to which it will continue to happen.
These assumptions are the consequence of heuristics such as simplification, filtering, framing, magnification and others. They are attempts by our brains to cope with the noise, and many of them are particularly prone to recency bias. Yet they also are often self-reinforcing when enough people hold them, as belief becomes truth in the market.

The second component is the market psychology that arises in the face of these trends. Our psychological constitution leaves us much more averse to losses than attracted to gains. Avoidance of regret is a primary human motive. Often, fear of making the wrong choice can lead to paralysis, when action would be the best course. The field of behavioral finance pays particular attention to the unexpected, illogical or irrational decisions we make when faced with this fear.

Third is the market’s strength. Here is where technical analysis seeks to decipher the market’s forces through indicators such as Ichimoku clouds and many others. Their purpose is to tell us how the market is reacting. They can have a strong descriptive and predictive potential by explaining not only how the market is moving, but what limits it might move within during the near term.

The value of a clearer head
The process of technical analysis is one of constant validation or invalidation, reassessment, and new assumptions. By measuring how fundamentals are being interpreted in the market and also how price is reinforcing itself through trends – the emotions and behaviors they are generating – you can manage the emotion of your own pricing decisions. It provides a different perspective and a complementary set of tools to traditional fundamental analysis. This is what we share with clients.
There is an apocryphal saying attributed to a few different economists: “Markets can stay irrational longer than you can stay solvent.”
The collective emotion in today’s commodities markets combined with your own individual emotion can throw your risk management strategy off track. The result can be the sinking feeling when you realize you made a trade that is not going to work out in your favor.
Consider using technical analysis to help lower the chances of having that feeling in the future.
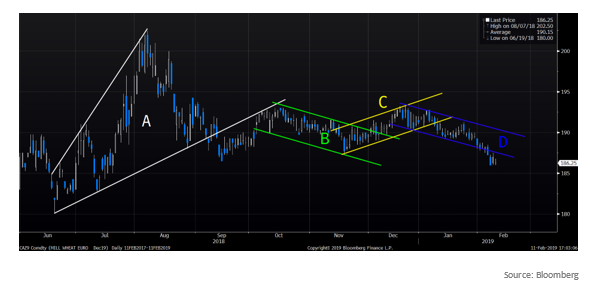
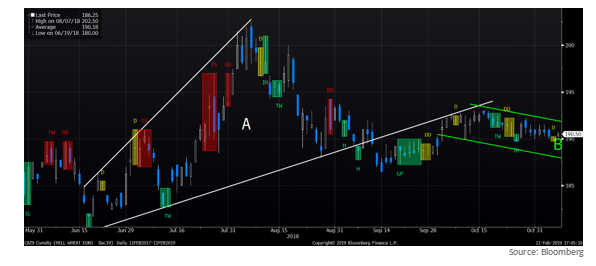
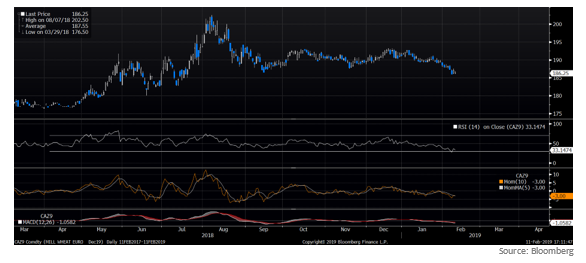
*Chart source: Bloomberg Terminal by Bloomberg
These materials have been prepared by personnel in the Sales and Trading Departments of Cargill Risk Management, a business unit of Cargill, Incorporated based on publicly available sources, and is not the product of any Research Department. These materials are not research reports and are not intended as such. These materials are for the general information of our customers and are a “solicitation” only as that term is used within CFTC Rules 1.71 and 23.605, as promulgated under the U.S. Commodity Exchange Act. These materials are provided for informational purposes only and are not otherwise intended as an offer to sell, or the solicitation of an offer to purchase, any swap, security or other financial instrument. These materials contain preliminary information that is subject to change and that is not intended to be complete or to constitute all of the information necessary to evaluate the consequences of entering into a swap transaction and/ or investing in any securities or other financial instruments described herein. These materials also include information obtained from sources believed to be reliable, but Cargill Risk Management does not warrant their completeness or accuracy. In no event shall Cargill Risk Management be liable for any use by any party of, for any decision made or action taken by any party in reliance upon, or for any inaccuracies or errors in, or omissions from, the information contained in these materials and such information may not be relied upon by you in evaluating the merits of participating in any transaction. All projections, forecasts and estimates of returns and other “forward-looking” information not purely historical in nature are based on assumptions, which are unlikely to be consistent with, and may differ materially from, actual events or conditions. Such forward-looking information only illustrates hypothetical results under certain assumptions. Actual results will vary, and the variations may be material. Nothing herein should be construed as an investment recommendation or as legal, tax, investment or accounting advice. Cargill Risk Management is a provisionally registered Swap Dealer and operates under “Order of Limited Purpose Designations for Cargill, Incorporated and an Affiliate.”
