Three Indicators to Start You Down the Technical Analysis Path - Part One
Likely, you have already heard about technical analysis. If you haven’t started using it yet, it could be because you are asking yourself, “How does it work in practice, and can I rely on it as a practical tool?” People ask me this all the time.
Starting to use technical analysis in your risk management programs may seem daunting, but the reality is that so many market participants use some of the core indicators in technical analysis today that studying them can help you understand the mood of the market. If you know which technical tools and indicators others are using to guide their decisions, it gives you a window into their thinking, like a chess match where you know the strategies your opponent regularly employs.
The first thing people should understand about technical analysis is that it doesn’t rely on one magical indicator. Looking at several indicators together can give you a more three-dimensional view of market sentiment. Doing so helps prevent blind spots or biases.
Looking briefly at a few indicators can help us grasp how they build a richer view of the market.
Three basic types of technical tools and indicators
1. Candlesticks
Among the oldest and most widely used technical tools, candlesticks first emerged in the rice market of Japan at some point in the last 200 years. They capture the open, close, high and low prices for a given period of time, as well as the overall intensity and direction of trading.
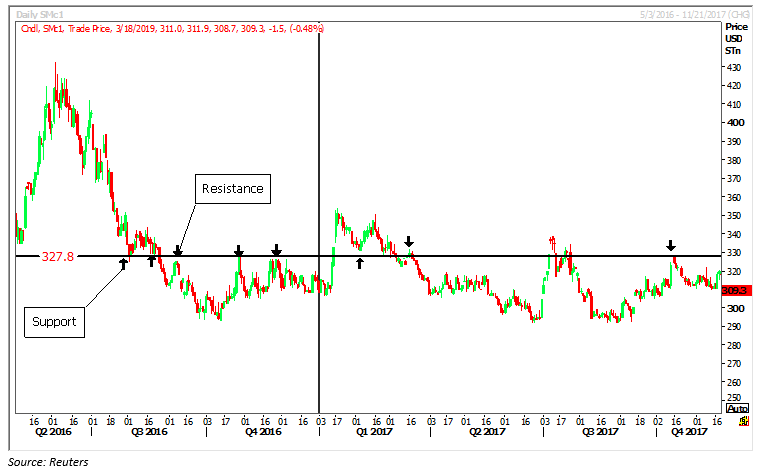
Closely analyzing candlesticks can help identify important price levels of support and resistance in the market. These levels reveal where many participants have set automated orders, and they essentially constitute the fair price of the moment. This gives you crucial information about what others are doing, thinking or perceiving, and which direction prices may go when they finally break through that level of support or resistance. It can help you cut through the noise of daily volatility.
 Movements on candlestick charts can reveal key pricing levels like this one for soybean meal in 2017.
2. Moving averages
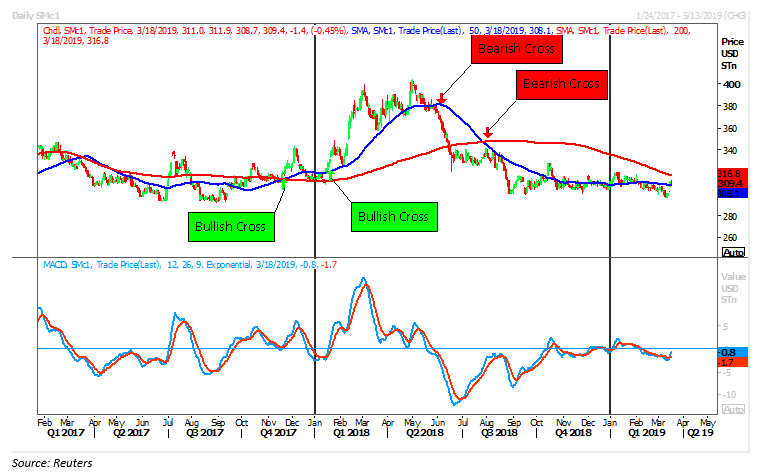
A weighted look at what prices have been doing during various intervals of the recent past can also give a good glimpse into market sentiment. The most basic form of this type of analysis is looking at simple moving averages compared to a price chart – 50- and 200-day moving averages are common intervals. When the market price crosses the 50-day moving average, this is a strong sign that a bullish or bearish trend is emerging.
 Simple moving averages can confirm a new trend. For example, the 50-day average crosses the 200-day average right before a longer period of lower prices.
Exponential moving averages can be even more precise indicators. When comparing the exponential moving average of intervals such as nine, 12 and 26 days, you can see how directional momentum is building, because the more recent days are weighted more heavily. These averages can be compared in different ways using oscillator tools.
3. Fibonacci retracements
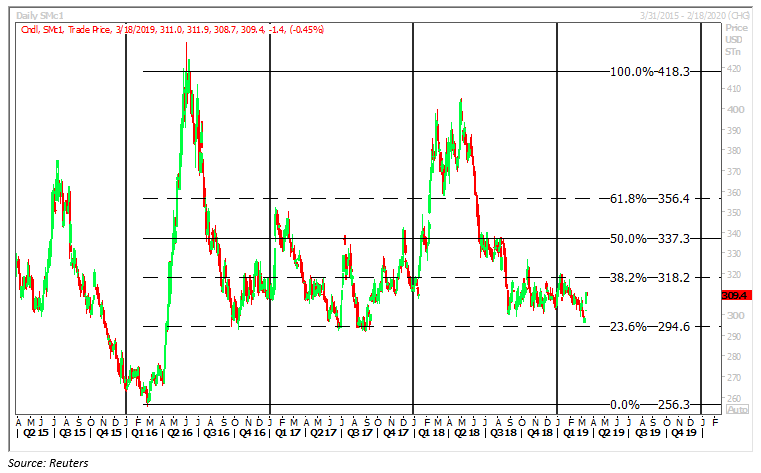
This indicator is shrouded in a bit of mystique. Fibonacci retracements are based on the golden ratio and the sequence of numbers studied by an Italian mathematician of the same name from the 13th century. Fibonacci sequences are found everywhere in nature, and at some point, traders noticed that price movements and ensuing retracements can correlate to them as well.
 Large price movements and the corresponding retracements toward previous levels frequently can correlate to percentages identified by Fibonacci sequences.
With so many participants watching Fibonacci sequences, the question becomes whether this type of pattern is some secret tendency of the market, or whether prices follow these ratios because everyone expects them to, making them a self-fulfilling prophecy. Regardless of which is true, the result is that they can often identify strong levels of near-term support and resistance in the market.
This article is the first in a series of two that can help you understand how technical analysis can help you decipher the sentiment of the market. Read Part Two to learn more about how these three indicators work together and how you can use them to provide you with more information that can help your business.
These materials have been prepared by personnel in the Sales and Trading Departments of Cargill Risk Management, a business unit of Cargill, Incorporated based on publicly available sources, and is not the product of any Research Department. These materials are not research reports and are not intended as such. These materials are for the general information of our customers and are a “solicitation” only as that term is used within CFTC Rules 1.71 and 23.605, as promulgated under the U.S. Commodity Exchange Act. These materials are provided for informational purposes only and are not otherwise intended as an offer to sell, or the solicitation of an offer to purchase, any swap, security or other financial instrument. These materials contain preliminary information that is subject to change and that is not intended to be complete or to constitute all of the information necessary to evaluate the consequences of entering into a swap transaction and/ or investing in any securities or other financial instruments described herein. These materials also include information obtained from sources believed to be reliable, but Cargill Risk Management does not warrant their completeness or accuracy. In no event shall Cargill Risk Management be liable for any use by any party of, for any decision made or action taken by any party in reliance upon, or for any inaccuracies or errors in, or omissions from, the information contained in these materials and such information may not be relied upon by you in evaluating the merits of participating in any transaction. All projections, forecasts and estimates of returns and other “forward-looking” information not purely historical in nature are based on assumptions, which are unlikely to be consistent with, and may differ materially from, actual events or conditions. Such forward-looking information only illustrates hypothetical results under certain assumptions. Actual results will vary, and the variations may be material. Nothing herein should be construed as an investment recommendation or as legal, tax, investment or accounting advice. Cargill Risk Management is a provisionally registered Swap Dealer and operates under “Order of Limited Purpose Designations for Cargill, Incorporated and an Affiliate.”
